Home | Gallery | AboutUs | Software | Rates ![]()
![]()
![]()
Controlled flight into terrain continues to be a factor in many aviation accidents. This reconstruction highlights a July 2000 accident involving a Cessna 195, registration N4377V, which crashed shortly after departure from Aspen/Pitkin County airport in VFR weather. The pilot and three passengers received fatal injuries. Download the NTSB Factual Report for this accident here.
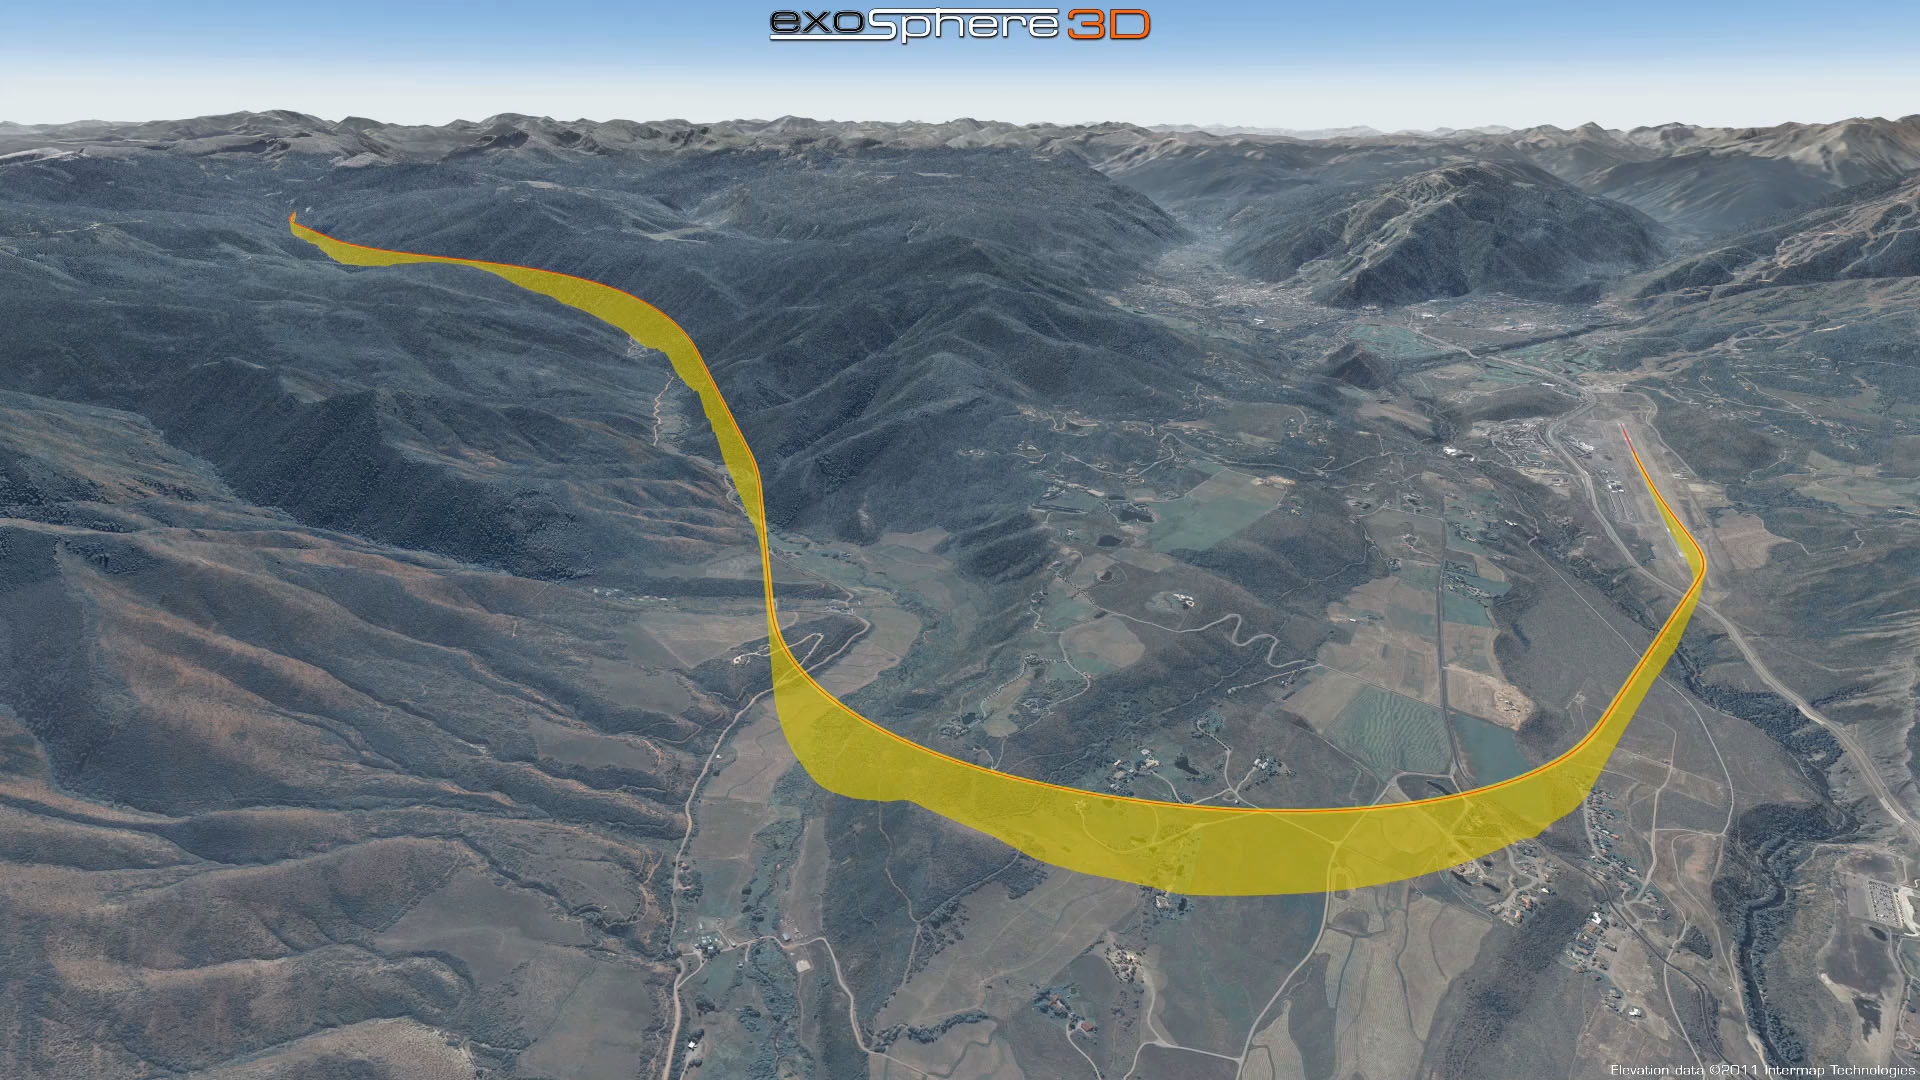
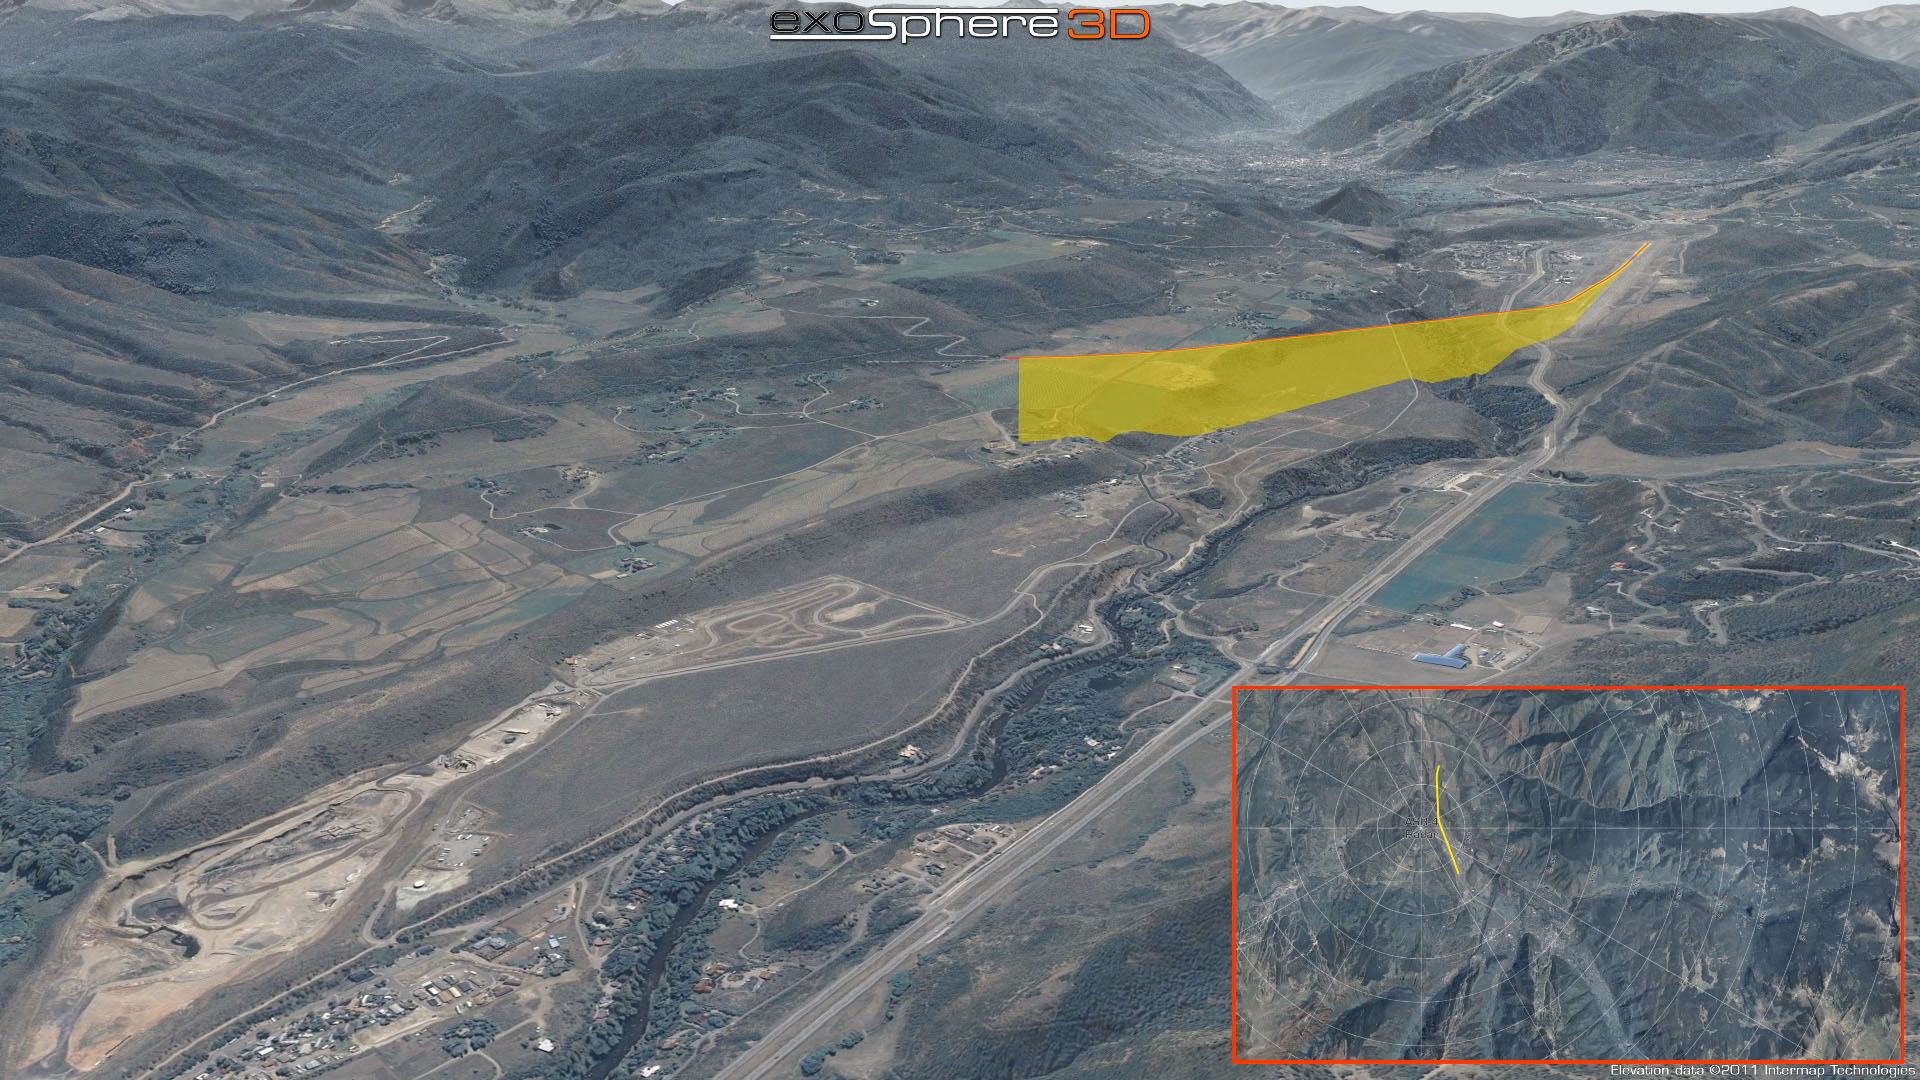
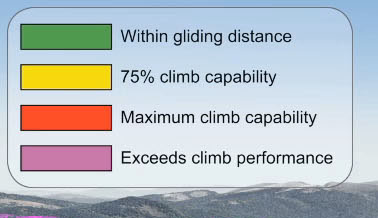
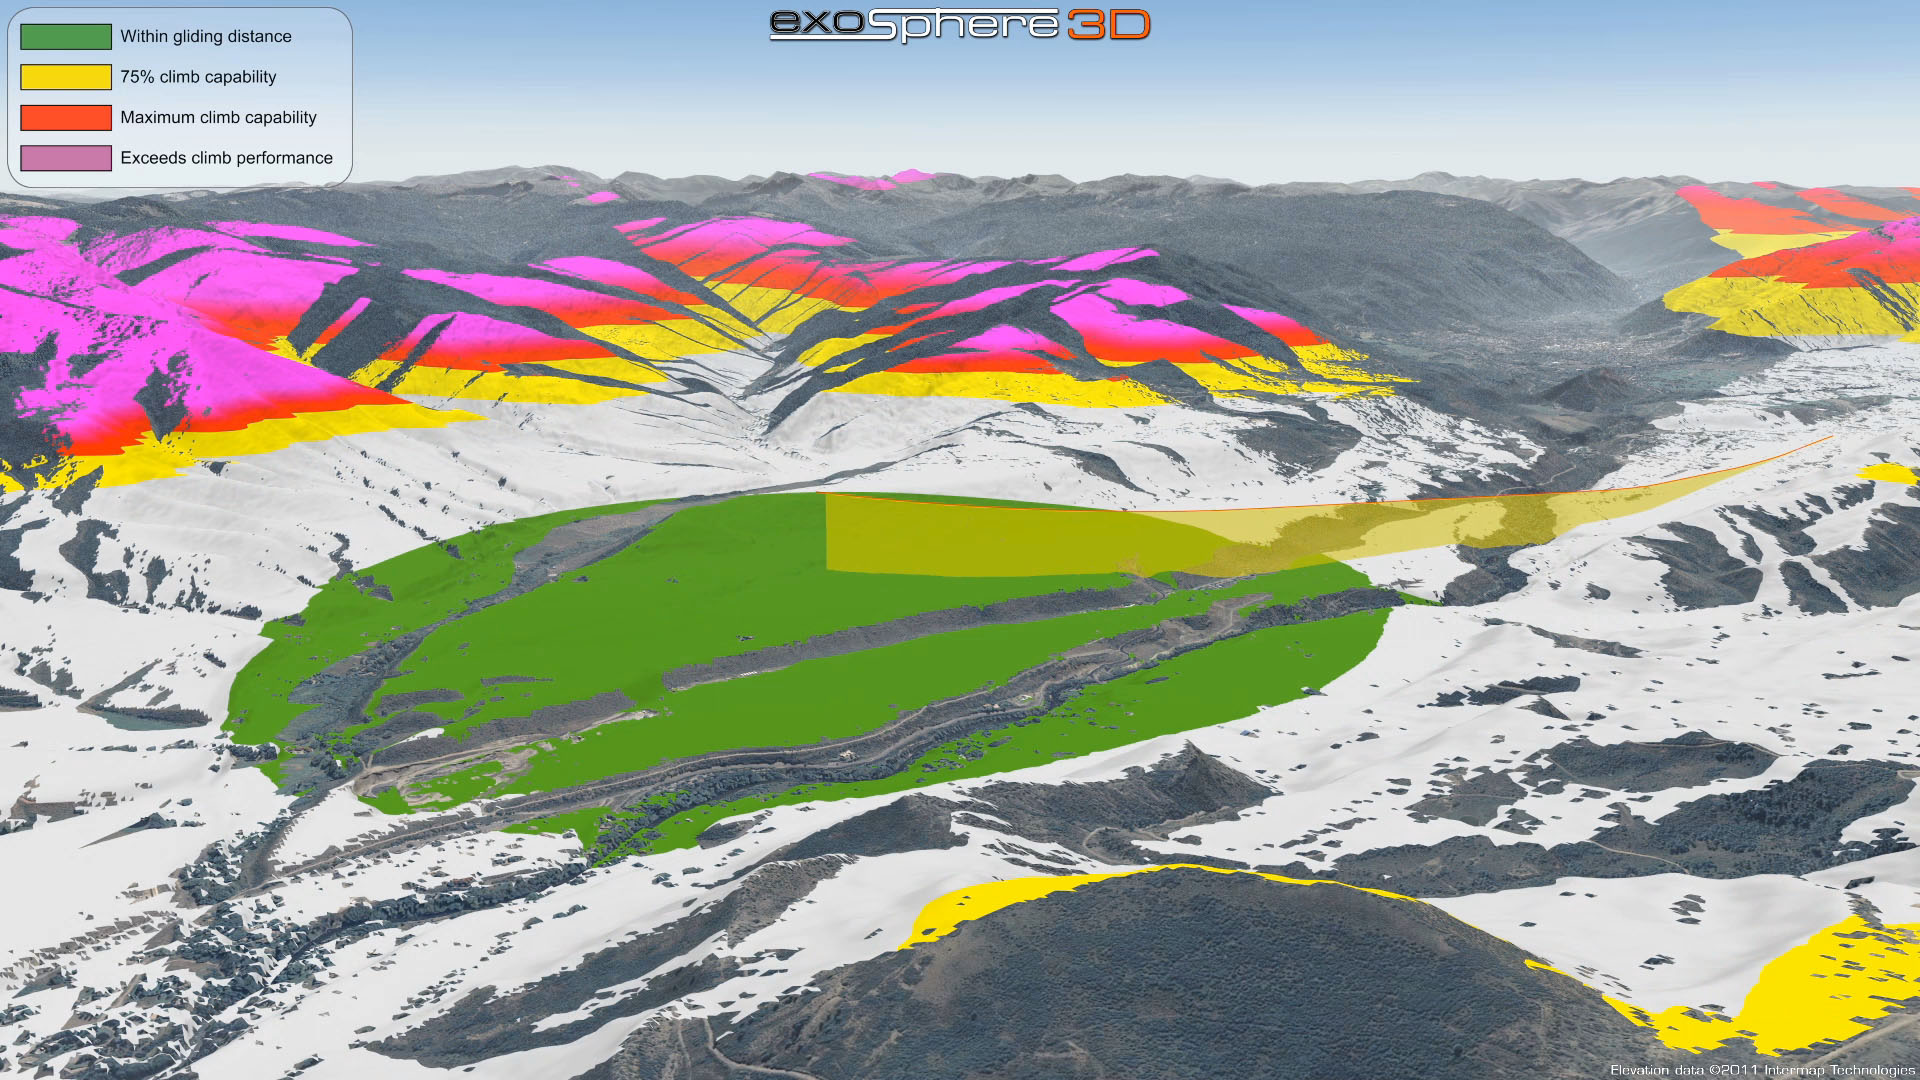
Utilizing our basic flightpath calculation techniques and the limited data available, we have created a probable departure course for the accident aircraft. The aircraft departed Aspen airport (ASE) around 11:20am and crashed shortly afterwards during a departure climb into a valley east of the airport. Colored gradients illustrate the climb performance of the Cessna 195 relative to the surrounding terrain. This performance gradient map is recalculated at every timestep throughout the animation based on the position, altitude and airspeed of the aircraft as well as air density and ambient temperature ("density altitude").
Additional sequences apply a viewshed mask to the climb performance gradient map. The viewshed is calculated from the aircraft location to the surface of the surrounding terrain. Both a typical viewshed as well as the "negative" of that viewshed are shown (i.e. terrain shadowed behind larger mountains or below the horizon due to earth curvature). Features in the viewshed could be seen by the pilot and would be part of the visual cues that he was receiving as he continued flight into the canyon. Terrain which was impossible to see from the aircraft's location would not be available as a visible reference for the pilot.
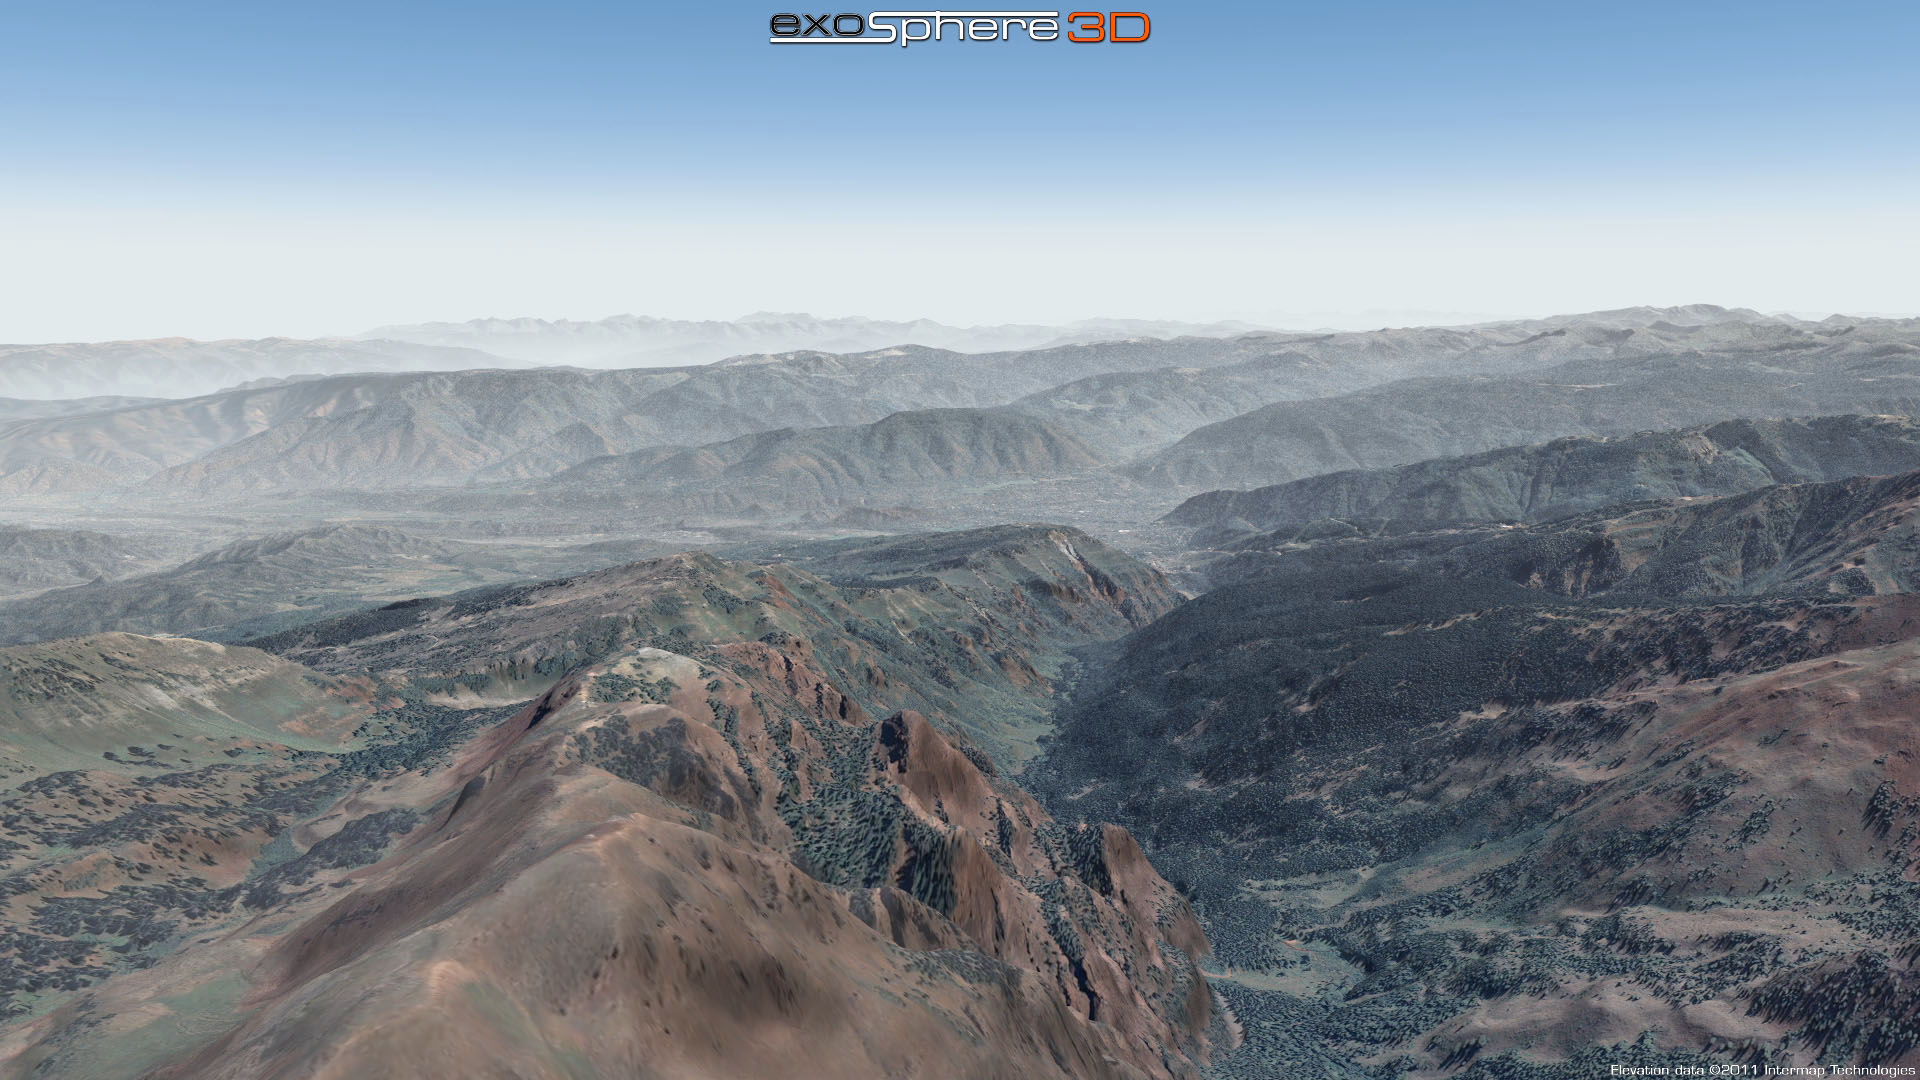
A viewpoint from the aircraft's location is rendered to highlight the lack of a horizon throughout the flight sequence. A flat horizon is an essential visual feedback component when judging flight performance and pitch attitude. Without this essential information, a pilot must rely more upon the indicated airspeed and artificial horizon for energy management and situational awareness.
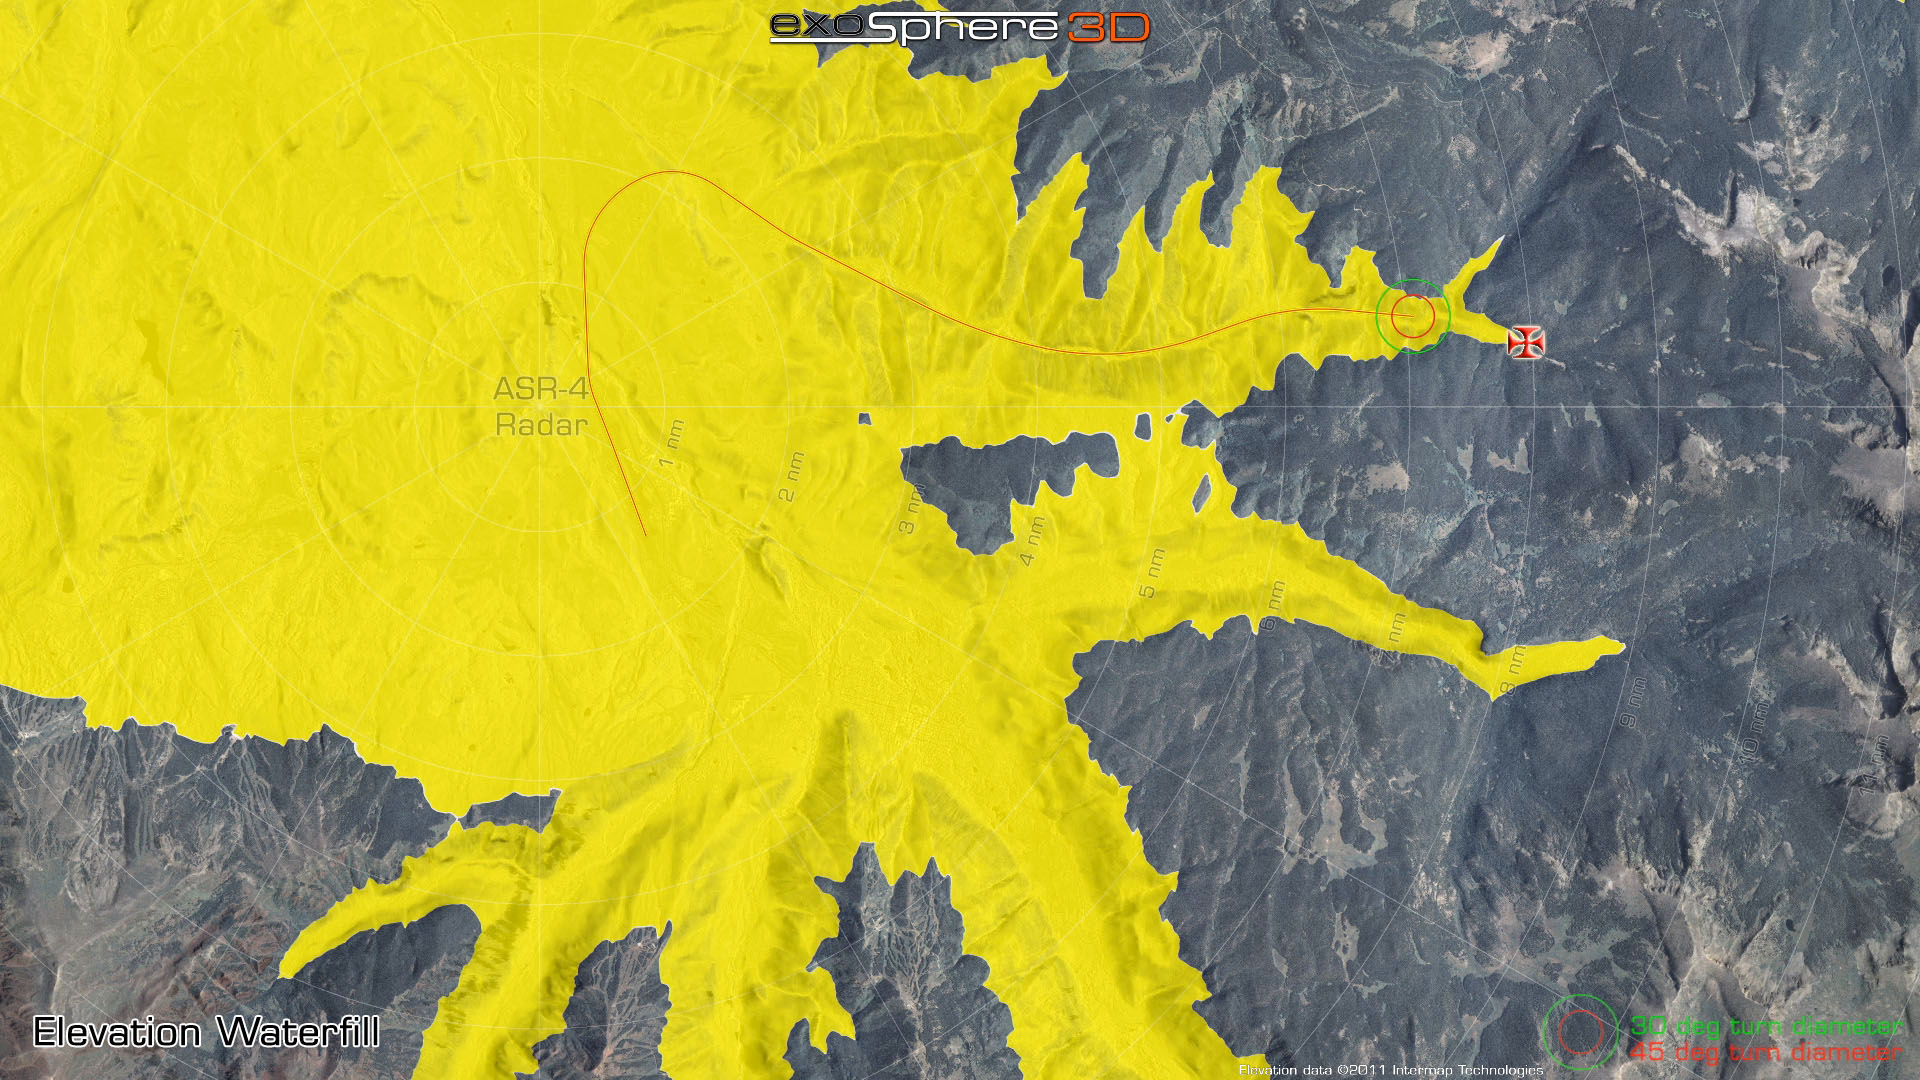
The "box canyon" nature of the accident is illustrated with an elevation waterfill technique and a simple 2D graphic circle showing the turn capabilities of this aircraft based on altitude and airspeed. As the pilot continues into the canyon, it becomes readily apparent that he does not have the ability to out-climb the oncoming terrain; nor can he turn around and fly out of the canyon. At any given frame of the waterfill playback, it is critical to note that the aircraft may NOT be able to hold altitude when in a 30 or 45 degree banked turn, thus reducing the available airspace for executing the turn.
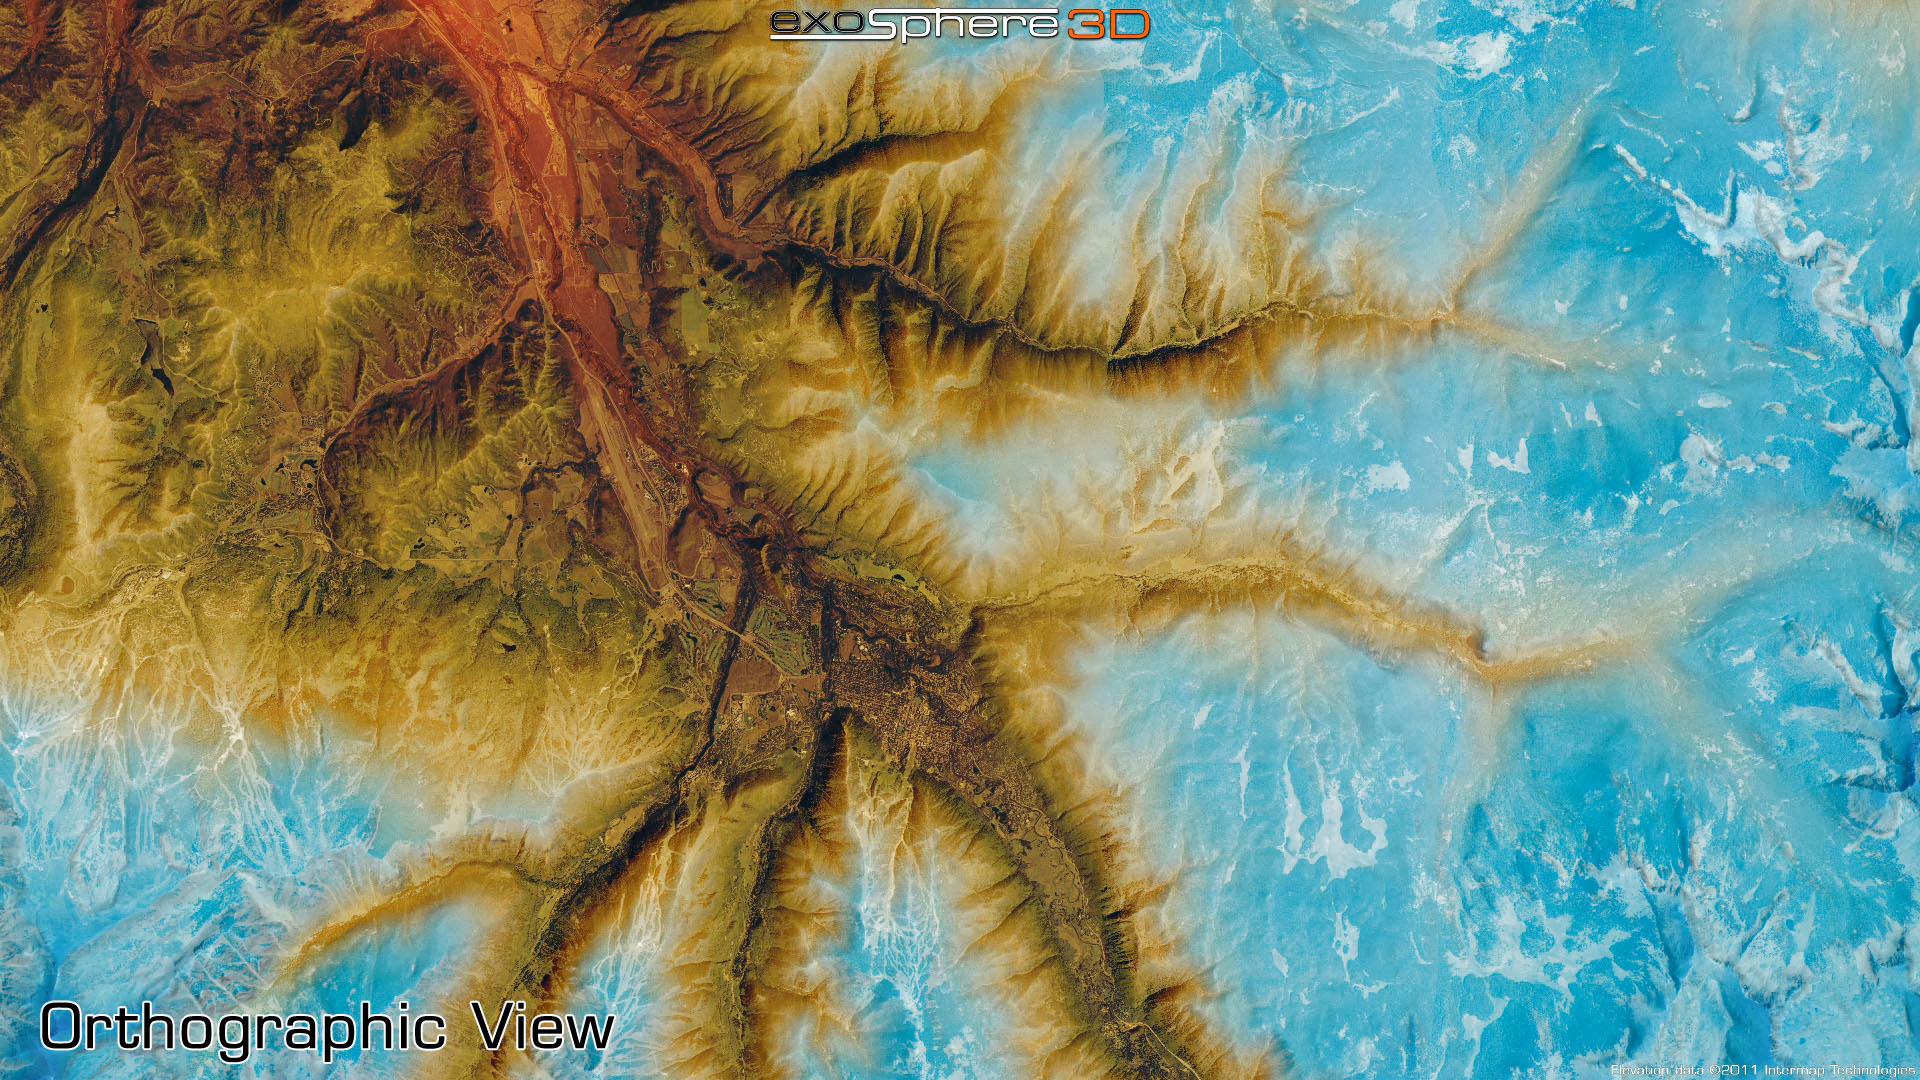
Intermap Technologies (http://www.intermap.com) has supplied us with their high resolution IfSAR-derived 5m terrain data (Interferometric Synthetic Aperature Radar). The public domain data available in this area is the United States Geological Survey 10m digital elevation model (USGS 10m DEM, a.k.a. "national elevation dataset" or NED). Intermap has mapped the entire USA (as well as many other parts of the world) at 5m resolution in both a "bare earth" and "first return" dataset, referred to as a Digital Terrain Model (DTM) and Digital Surface Model (DSM), respectively. The DSM adequately represents surface features such as trees and other significant vegetation as well as buildings and other urban clutter. The DSM is essential in a reconstruction animation as it provides additional feedback of scale and depth perception. In traditional 2D map analysis, hillshading of the DSM and DTM offer significant advantages in feature recognition. Intermap also offers a 1m Orthorectified Radar Image (ORI) in conjunction with the terrain data. The ORI is a complement to visible or infrared spectrum imagery and provides additional insight when performing feature recognition and visual analysis. All data utilized is part of Intermap's NEXTMap 3D Mapping Program.
A typical rendered frame represents over 26 million terrain polygons and 3 gigapixels of surface imagery. Approximately 200 hours went into the entire project, including creation of the project webpage and the timeline editing of the sample videos. Rendering full 1080HD frames in Lightwave3D uses approximately 28Gb of RAM and takes anywhere from 1 to 4 minutes per frame, depending on the texture calculations (viewsheds, gradients, etc).
Copyright 2011 Exosphere3D.com